File:Standard deviation diagram.svg

Size of this PNG preview of this SVG file: 400 × 200 pixels. Ither resolutions: 320 × 160 pixels | 640 × 320 pixels | 1,024 × 512 pixels | 1,280 × 640 pixels | 2,560 × 1,280 pixels.
Oreeginal file (SVG file, nominallie 400 × 200 pixels, file size: 17 KB)
Ootline
| Descreeption |
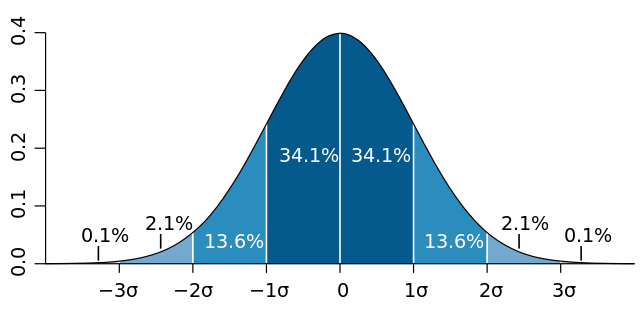
English: Normal distribution curve that illustrates standard deviations. Each band has 1 standard deviation, and the labels indicate the approximate proportion of area (note: these add up to 99.8%, and not 100% because of rounding for presentation.)
Français : Courbe de distribution normale montrant l'écart type. Chaque bande verticale a une largeur d'un écart type et les pourcentages indiquent leur valeur approximative rapportée à la population totale. Note : du fait des arrondis, le total est de 99,8 % au lieu de 100%. |
| Date | |
| Soorce | Ain wirk, based (in concept) on figure by Jeremy Kemp, on 2005-02-09 |
| Author | M. W. Toews |
| Other versions |
|
.svg)
Licensin
This file is licensed under the Creative Commons Attribution 2.5 Generic license.
- Ye are free:
- tae share – tae copy, distribute an transmit the wirk
- tae remix – tae adapt the wirk
- Unner the follaein condeetions:
- attribution – Ye must attribute the wirk in the manner specified bi the author or licensor (but nae in ony way that suggests that thay endorse ye or yer uise o the wirk).
File history
Clap oan ae date/time fer tae see the file aes it kithed at that time.
| Date/Time | Thummnail | Dimensions | Uiser | Comment | |
|---|---|---|---|---|---|
| current | 02:06, 15 Januar 2015 | | 400 × 200 (17 KB) | GliderMaven | Average is now zero not mu |
| 11:08, 7 Apryle 2007 |  | 400 × 200 (14 KB) | Petter Strandmark | == Summary == Standard deviation diagram, based an original graph by Jeremy Kemp, in 2005-02-09 [http://pbeirne.com/Programming/gaussian.ps]. This figure was started in R using: <pre> x <- seq(-4,4,.1) plot(x,dnorm(x),type |
Eimage airtins
The'r nae pages airts tae this eimage.
Global file uisage
The follaein ither wikis uise this file:
- Uisage on af.wikipedia.org
- Uisage on ar.wikipedia.org
- Uisage on ast.wikipedia.org
- Uisage on as.wikipedia.org
- Uisage on ba.wikipedia.org
- Uisage on be-tarask.wikipedia.org
- Uisage on bg.wikipedia.org
- Uisage on bn.wikipedia.org
- Uisage on bs.wikipedia.org
- Uisage on ca.wikipedia.org
- Uisage on cbk-zam.wikipedia.org
- Uisage on cs.wikipedia.org
- Uisage on cv.wikipedia.org
- Uisage on cy.wikipedia.org
- Uisage on dag.wikipedia.org
- Uisage on da.wikipedia.org
- Uisage on de.wikipedia.org
- Uisage on de.wikiversity.org
- Uisage on el.wikipedia.org
- Uisage on en.wikipedia.org
View mair global usage o this file.